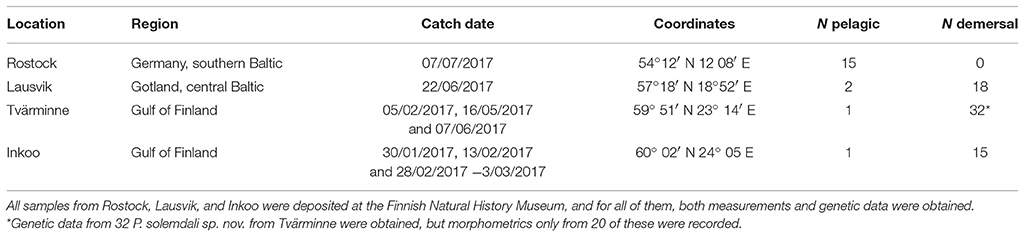
Original figure caption: Map of the Baltic Sea showing (A) modeled mean bottom salinity in the Baltic Sea from Bendtsen et al. (2007) and the borders and names of ICES subdivisions [i.e. SD 23, SD24, etc.]; deep-water basins where pelagic flounders can reproduce have a salinity above 11 psu (green color) and are indicated by arrows, and (B) the sampling locations from this study (large pie charts with black rings and bold text labels) and from Momigliano et al. (2017a) (small pie charts and italics text labels), with an inset showing the position of the study area within Europe. Pie charts represent the proportion of demersal flounders (P. solemdali sp. nov., in red) and pelagic flounders (P. flesus, in blue) identified by genetic tests in both studies, and thus give a contemporary snapshot of each of the two species distribution in the Baltic Sea and their relative abundance. To be noticed that P. flesus were present in almost every location (with the exception of Öland and Åland), while P. solemdali sp. nov. distribution seems not to extend to the southern Baltic Sea. Abbreviations are as follows: UFI = Helsinki, Gulf of Finland (Momigliano et al., 2017a); INK = Inkoo, Gulf of Finland (this study); TVÄ = Tvärminne, Gulf of Finland (this study); HAN = Hanko, Gulf of Finland (Momigliano et al., 2017a); ÅLA = Åland Archipelago (Momigliano et al., 2017a); IRB = Irbe Strait, Estonia (Momigliano et al., 2017a); GOT = Lausvik, Gotland (this study); KVÄ = Kvädofjärden, Sweden (Momigliano et al., 2017a); LAT = Latvian Sea, Latvia (Momigliano et al., 2017a); ÖLA = Öland, Sweden (this study; Momigliano et al., 2017a); BOR = Bornholm Basin (this study; Momigliano et al., 2017a); GDY = Gdynia, Poland (Momigliano et al., 2017a); DAB = Dabki, Poland (Momigliano et al., 2017a); ROS = Rostock, Germany (this study), BAR = Barsebäck, Sweden (Momigliano et al., 2017a); KAT = Kattegat, Sweden (Momigliano et al., 2017a); GUL = Gullmaren, Sweden (Momigliano et al., 2017a). For further details on sampling locations from this study and from Momigliano et al. (2017a) see
Table 1 and
Table S1.


